EQUITY TRADING
IBM
Below are some examples of the Gann method of the Square of Nine for calculating support and resistance on IBM.
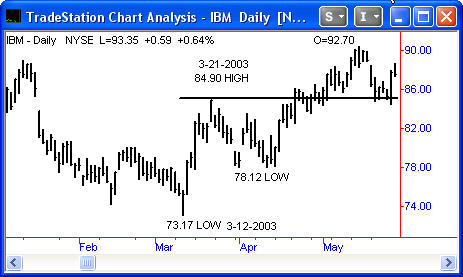
In the chart below, with price approaching 85, there are three indications of a possible reversal in price. There are two Class 2 algorithms pointing to 84.9 to 85.1. There was one Class 4 pointing to the same price area. One cannot use one Class 4 alone as an indicator of a price reversal. Multiple Class 4 algorithms on stocks may be used. In this case, with two Class 2 algorithms, one may use the Class 4 as an affirmation.
One of the algorithms is connected to the date of March 21, the day price touches 84.9. The date makes the algorithm more useful. From this high, IBM dropped to 78.12.
It is important to realize that these calculations represent support and resistance levels only. There is nothing in these calculations that determines the trend length or direction. One must trade the situation in the present, taking partial profits to deal with the unknown duration of the trend.
As a further confirmation, once a price has been targeted, one can use the Balanced Angles approach if there are limited indications from the Gann method. Below is a diagram from the Square of Nine showing how the variables are 90 degrees apart and therefore balanced. The PET-H date is one day off. The 21st was the date that 84.9 was touched.
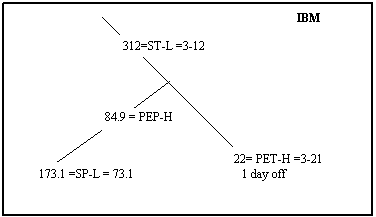
Without having an indication of 85 from the Gann method, I would not have been able to draw the Balanced angles. One can use the technique if the evidence for a reversal is scant. One will not find the technique of value when used alone for the simple reason that there are too many possible outcomes. The whole value of the Gann method is that the method pinpoints a specific price close to the prevailing price.
Once the up trend topped in IBM at 90.4, the first two support points I found were right at the actual lows of two wave movements. There was one indication of support at 85. A low occurred first at 84.89 and then 84.5. In this case, price went .50 past the support point for a very short period of time and then rallied very quickly.
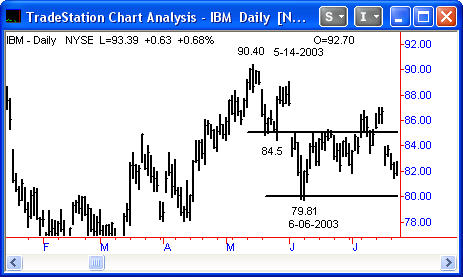
A more important set of indications for support was found at 80. There was a Class 2 set-up at 80 and two PT4Vs at 80. The low came in at 79.8 or .20 below the targeted support. The MOD3 and PT4V algorithms are stronger indications than just a basic Start Price Class 1 algorithm.
In the next chart of IBM, the indications are fewer than in previous examples for each support point, but work well.
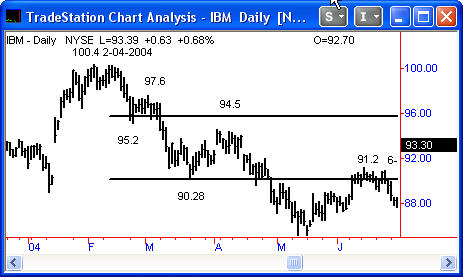
One Class 1 algorithm indicates a low target support point at 95.6. The first low occurs at 95.2 followed by a two point rally. A SP-YCH algorithm indicates 90.1 as a support point. A low is put in at 90.28 followed by a four point rally.
In the final chart of IBM, I used the lower top of 91.2 as a Start Price. There were several indications at 83. The lowest price was 83.42.
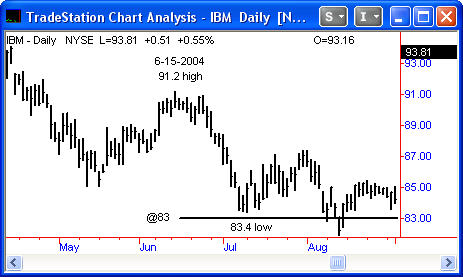
In this example, price failed to reach the target area by .42 cents. The price of IBM then rallied to the 87 area. I used this example to again show how price won't always go to the precise point as calculated. Gann inferred prices would touch their precise points in the examples in the 1909 article. A close inspection of his trading examples will show prices did go thru several of his target prices for a short period of time.
In one of the Union Pacific trades, price broke several points below the target price of 52 1/2 intra-day. In the New York Central trade, prices went above the target of 145-146 (to 147 3/4) for a few days before dropping very quickly and substantially.
In the previous pages I showed six or seven calculations for each of the three securities reviewed. Some support points failed to work, while the majority of the calculations were actual support/resistance and were not penetrated by more than .40 in most cases. There were several examples where price failed to reach the target prices by approximately .40.
What one does after a successful stock entry trade is basically left up to the individual trader. How long to hold and how much profit to take are both good points for each trader to consider when devising one's trading plan.
Copyright ©2001 The StockTimefactor - All Rights Reserved

