EQUITY TRADING
GENERAL MOTORS
The next chart shows how the Start Time and Start Price algorithms point to a change in trend in GM when price hits the 43.4 to 43.7 range. The price topped at 43.2, so the high was a little shy of the target. One must take into account the price failing to quite reach the target and also overshooting the target. There is no ON DATE algorithm to confirm the 43.2 top.
The reaction from this top went to 40. There is no indication that 43.2 could be the final top. I know of no model that can calculate the final top or bottom.
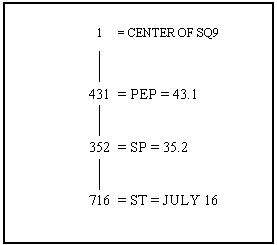
In the early years of searching for Gann's algorithm, I came up with the concept of BALANCED ANGLES. It was a good hindsight 20-20 method, but it was difficult to use effectively in advance. The concept can be used as a confirmation of the Gann method when the ON DATE algorithm is not present as in the example above. One type of BALANCED ANGLES looks something like the figure below where the Start Price-Start Time-Possible End Price all are on the same angle. In this example, all the variables are 0 degrees to each other and this is one type of balanced angles.
Many times the fourth variable, PET or Possible End Time will occur in the algorithm. In this case, the date of the 4th comes into play on the angle on the other side of the Square of Nine. It is one day off since the top was on the third of the month. I found this concept in many of Gann's trades.
3M
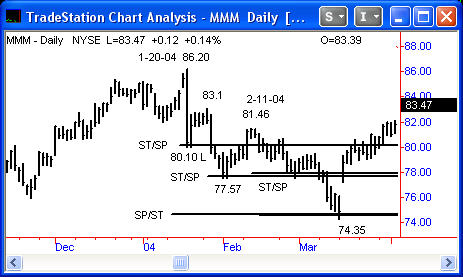
In the 3M chart below, the Start Time and Start Price algorithms identify each low in the movement from the January 20, 2004 top at 86.20. I also used the February 11, 2004 top as a starting point (once it was apparent the downtrend was still in progress) to help identify more support points.
There is a Start Price and Start Time algorithm pointing to 80. The low was 80.1. There are three indications for support at 77.8, 78.1, and 78.5. The average is 78.1 and the actual low was 77.57.
The lower top on February 11 points to the first low off that top and helps confirm the final low in the downtrend. There are several indications at 77.9. The actual low of this movement was 77.6 or .30 cents below the support point.
From the top on January 20 high, a Class 1 support point is indicated at 74.7. From the February 11 high, a MOD3 algorithm shows 74.6 as support. The final low was 74.35, about .30 below the indicated support points from both tops. This low corresponded with a three wave movement in 55 days. See the Appendix of the workshop manual for the article describing this technique written in Stocks and Commodities magazine.
The numerous algorithms show many support points. In Gann's trades in the 1909 article, no mention is made of the many possible reversal points between the Starting Price and the Possible End Price. He wanted to infer that he knew where the exact end point was located. I don't believe he knew which price was the final End Price.
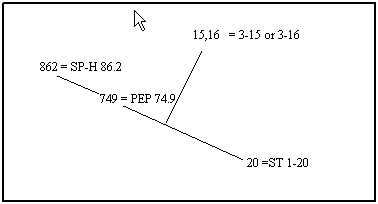
It is only an afterthought that I decided to show BALANCED ANGLES in these examples. I mentioned above how all four variables frequently show up in this algorithm. All four variables in this second type of balanced angles algorithm show up in this 3M example. In this case, all the variables are 90 or 0 degrees apart, and are therefore balanced to each other.
The SP-PEP-ST are all on the same angle with the date of the low 90 degrees away. Depending on the wiggle in the Square of Nine, either the 15th or 16th shows up as the Possible End Time.
Copyright ©2001 The StockTimefactor - All Rights Reserved