AN OVERVIEW OF EQUITIES
In the pages that follow I will show support and resistance levels calculated with the Gann method on three different securities using six or seven examples on each stock.
One important factor is to apply the method on a security that is active and not dull. Gann himself said this and it is true. One wants to trade stocks that move and have enough liquidity and volatility to make reasonable movements in a given period of time.
The discussion of the algorithms and their names will not make sense to the reader at this point. I just wanted the reader to understand that a multiple of models were used in different support and resistance calculations. The actual price reversal points are compared to the indications given in the examples. Usually, there is no more than .40 gap between the calculation and the actual reversal, either shy or past the indicated numbers. Sometimes in a fast move, there is no reversal found.
GENERAL MOTORS
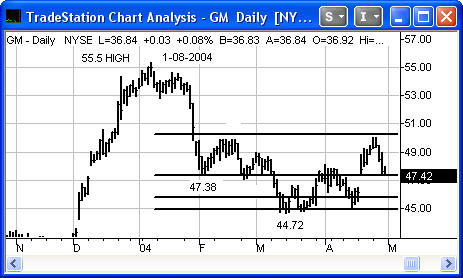
In the General Motors chart below, I have drawn a horizontal line across ALL the price points that show up with the START TIME and START PRICE algorithms. Note that there are four price points between the high of 55.5 and the low of 44.7. In the 1909 article, Gann was only providing the reader with the final high or low price. By only giving the terminal point, the article implies there is some method to calculate the length of a movement into the future and what price will be the lowest or highest final price. If there is a way, I don't know what it is.
Of the four support points indicated, two provide excellent buy points and two support points fail to hold prices. The first support point, at 50.4, falls victim to a very fast market and likely some negative news was released around that time.
The support points were 50.4, 47.6, 45.7, and 44.7. There was a low at 47.3 and a final low at 44.7.
What one does not know is whether the support points are major or minor support points. In addition, one must guesstimate the trend. The points are useful to give one an edge, but one still has to "trade the stock".
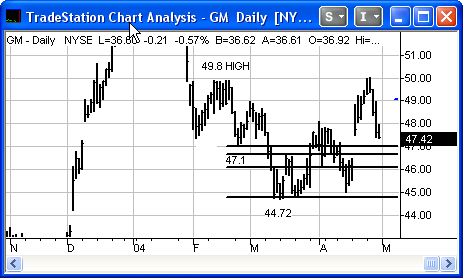
Using the lower top of 49.8 on February 19, one can get three more support points. Two of the three support points work. The last support point that works coincides with the support point off the 55.5 top.
The support points are 47.2 to 46.7, 45.8, and 44.8. There was a low at 47.1 followed by a two point rally. The 45.8 support failed. Note that 44.8 and 44.7 were support points from both tops, making this price a strong support level. The final low was put in at this price.
Copyright ©2001 The StockTimefactor - All Rights Reserved