TRADING THE SP 500
To get an understanding of how one uses the Gann method on the SP 500, I have drawn a simplified chart of the SP 500 covering a hypothetical three day period. It is a fictional diary of trades that describe a philosophical approach to day trading the SP500. I will go through each day and describe some of the best ways to trade using the algorithms for calculating support and resistance. These ideas are for the SP500 only and do not apply to stocks. Many of the short-term trades that are profitable entry trades can be held for longer time durations with trailing stops.There are many abbreviations used in the chart to describe the algorithms used. I am not going to explain them any more than I have. It is not necessary to understand their meaning as much as it is to understand how they are being used to trade. If one is not familiar with a Square of Nine, one may have trouble with the general discussion.
In the example, an important low begins on Day 1. For training purposes, we will assume a MOD3 indication for the low of the Day on Day1. From this indication, a long position is taken. The low of the day and/or low of the recent trend is the new Start Price Low or SP-L. Using various "equated" Start Price numbers, by floating the decimal, one can arrive at several Class 1 resistance points as the price rises.
From this SP low, one can make several calculations for the day. The first indications that we can draw are several basic Class 1 resistance points. I have learned the hard way not to take these Class 1 points (intra-day in the SP500) too seriously, especially in a fast moving market. My opinion, is that the Class 1 resistance points are best used as support points to add long positions when the short-term trend is up. Why? Note the first point offers no resistance and the second Class1 offers only a small reaction of 2 points or so. The best entry is after price comes back to the first Class 1. A long position is initiated as the first Class 1 set-up now becomes strong support. A buy can be set .25 above the Class 1 with a 1 point stop. Sometimes it is a 1 1/4 point stop, sometimes .75. It depends on how close to the sweet spot the entry was made.
One then looks to calculate an On Date/Start Price-Class 1 target as a possible decent reversal point or high of the day. In conjunction with this, one looks for a Range of Day or Movement price point to match this algorithm. One knows the low of the day and the On Date, so the third variable is possible to find as a complement to the On Date/Start Price-Class 1 algorithm.
In the chart, there is an OD/SP-YCH at somewhat higher prices than the Class1 price level. This is reflected in the chart as RD-H or Range of Day High. One may want to take profits or short the market at this price level or just hold for more upside. These are just some of the choices the trader must still make. In effect, a profitable short-term position can become a longer-term position. One may want to use two separate accounts to trade this way.
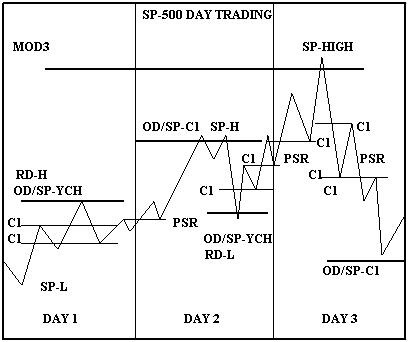
On Day 2, price makes a slightly higher high early in the session. As price comes back to the previous high as a small reaction, one attempts to take a long position trade based what is called a Prior Support Resistance level or PSR. This price might also have been the GLOBEX high of the night session that has just been broken to the upside. This is the Water Table Effect I talked about on the previous page.
The hypothetical trader now has a long position and is looking for a profit taking point or short sale price level. Since this trader has multiple contracts, he takes some profit at 2 points, and holds the rest. Price breaks thru yesterday's high and stops at an On date/Start Price-Class1. No Range of Day algorithm is easily found.
The trader now takes a short position with a 1 1/4 point stop. This top now becomes a SP for a down move. One can calculate a Class1 support level, which true to form, offers no support on a fast move down. With the high of the day likely set by the OD/SP-C1 one can look for a Range of the Day low. A price is found that matches an On Date/Start Price-YCH at lower prices. This is the spot to take short profits and take a long position. The trend is still up from the day before and no trend breaking decline has occurred.
After the low is put in, look at the Water Table Effect as price rises above the failed Class 1 and falls back to it. This is a second long side position entry to move with the trend indicated by price rising above the Class1 after the low of the day has likely been set. Near the close, another Class 1 resistance point offers a small reaction away from it and comes back to the previous high-forming a third possible long entry point at the PSR point.
On Day 3, the trader has found a MOD3 price indication that could be a significant selling level for the balance of the day. Before that point is reached, price rises past another Class 1 price level and falls back to it. Our nimble trader takes a long position on the Class 1 price level with a 1 point stop. The trade turns out to be a profitable entry position and he takes some profits at 2 points and holds some long positions.
No On Date/Start Price Class 1 high or Range of Day algorithm is found at the MOD3 price level. Regardless, our trader takes all profits near the MOD3 price level and takes a short position. Subsequently, price drops right thru the first Class 1 support, bounces 2 points off the second Class 1 support point, and comes back to the first Class 1 from below. Using the Water Table Effect, and the knowledge that a MOD3 high of the day is likely in, one can take another short position .25 below the Class 1 hit as resistance from below with a 1 point stop.
One more short entry is possible at a PSR point. If the trader missed all three possible entry points, one can just forget getting short at lower prices.
An On Date/Start Price-Class1 is found as a possible low support point and all the short positions are covered near that price level.
Hopefully, this analysis has given one an idea of how support and resistance points work on the SP500 with this approach. Tight stops are used in all cases. Entry points are positioned only at calculated levels from the Square of Nine or PSR or Globex points. Choices as to the trend must be made by the trader, because if the recent trend assumption or bullish/bearish bias is wrong, these points won't work. In the end, these support/resistance points coupled with extreme discipline, can give one an edge in trading this index.
Copyright ©2001 The StockTimefactor - All Rights Reserved